
How To Do Bar Chart Questions in IELTS Reading for 8+ Band
In the IELTS Writing task 1, you will be asked to explain a Bar chart which usually illustrates the significant changes, occurred during a certain period of time.
Bar charts are comprised of horizontal or vertical rectangular bars and the length of these bars is proportional to the data values that they depict.
In this blog post, you will find everything you need to answer the bar chart questions effectively to score 8+ Band in IELTS Writing task 1.
Section 1
-
- Analyzing the Question
Section 2
-
- Main Features
Section 3
-
- Structure for Answering Bar Chart Questions
Section 4
-
- Example
Section 1: Analyzing the Questions
An important thing to do before answering bar chart questions in IELTS writing task 1 is to correctly analyze the question. At first, you have to decide whether the bar chart is static or dynamic.
- In Static Bar charts, the illustrated data relates to one particular period of time.
- In Dynamic Bar charts, the data displays two or more periods of time.
The information included and the kind of language (tense, grammar, etc.) used to write factual data from the chart, differs for the static and dynamic form.
Section 2: Main Features
In the IELTS writing task, you are asked to ‘identify and report the main features’.
So you have to spot significant information from the chart and write it in your essay and exclude remaining information from your answer which is not important enough.
Incorporating all the information you see is one of the biggest mistakes you can make.
Information you should always look for:
- Highest/Lowest values
- Biggest differences
- Similarities
- Significant exceptions
- Anything else that stands out
Section 3: Structure
To create a solid structure in your writing test:
- You will always follow a 5-paragraph structure. Each paragraph will be focusing on just one thing. A paragraph can be as short as two lines. It doesn’t have to be a big block of text. There will always be one introduction paragraph, 3 body paragraphs, and one closing paragraph.
- You will use simple English. This is counter-intuitive to what you are taught elsewhere. Everybody else tells you to focus on learning new words to increase your vocabulary.
There are two reasons to do this:
- The amount of time you will waste in learning new vocabulary will not have any significant impact on your IELTS score. Instead, if you focus on learning smart hacks and techniques, you will see a disproportionate increase in your score.
- Wrong use of a difficult word in your writing will get you negative marks, but the use of the simple correct word will not affect it negatively. If anything, it will add to an overall flow of writing and help you score more.
Below are some tips on how to follow the 5-paragraph structure of Bar Chart Questions:
Paragraph 1: Paraphrasing and Explaining the Chart Statement
In the first paragraph, you have to introduce the chart statement.
The introductory paragraph needs to be very simple.
You will paraphrase the question given by IELTS.
You need to write the question statement again, but with different words.
The best strategy for that is to use synonyms to replace some of the words and the other strategy you can use is to change the flow of the sentence together with replacing the words with synonyms.
The first paragraph mostly consists of one sentence. You can also state the units of measurement written in the chart.
Paragraph 2: The Overview
In paragraph 2 you will provide an overview of main features.
Overview usually consists of two to three lines and is the most important and essential part of your writing task as the examiner is especially looking for features you have figured out from the diagrams.
You’re not allowed to use any kind of data in the overview.
All you will do in the first 3-5 minutes is identifying two or three main features and/or Key comparisons.
Identify 2-3 key comparisons and/or trends from the chart.
You have to look for the biggest/smallest, highest/lowest comparisons, and overall trends.
These should be the most obvious things from the chart. You have to assemble them and present them in an overview.
Paragraph 3: Analyze Data in Detail
Analyzing data for paragraphs three and four is just an extension of your overview.
In this paragraph, we become more particular about features and add data.
You must support your paragraph through data and numbers.
From the overview, select two main features and discuss them in detail using numbers and data from the chart.
This Paragraph usually consists of 2-4 lines.
Paragraph 4: Analyze Data in Detail
You have to do the same thing as you did in Paragraph 3.
Take the remaining two or three features and explain them in detail.
Support your paragraphs by using numbers and data from the Chart.
This Paragraph usually consists of 2-4 lines.
Paragraph 5: Summary
The summary is just one line. It’s not important. It’s even optional. It is similar to the paraphrasing of the question.
*You must check for spelling mistakes and grammatical errors after finishing your essay. Also, confirm that the data you mentioned is correct.
Section 4: Example
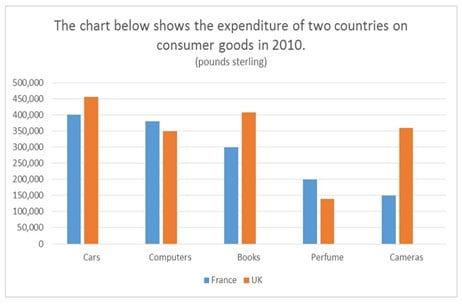
The chart below shows the Expenditure of Two countries on customer good in 2010.
IELTS Bar Chart Sample Answer
The chart illustrates the amount of money spent on five consumer goods (cars, computers, books, perfume, and cameras) in France and the UK in 2010. Units are measured in pounds sterling.
Overall, the UK spent more money on consumer goods than France in the period given. Both the British and the French spent most of their money on cars whereas the least amount of money was spent on perfume in the UK compared to cameras in France. Furthermore, the most significant difference in expenditure between the two countries was on cameras.
In terms of cars, people in the UK spent about £450,000 on this as opposed to the French at £400,000. Similarly, the British expenditure was higher on books than the French (£400,000 and £300,000 respectively). In the UK, expenditure on cameras (just over £350,000) was over double that of France, which was only £150,000.
On the other hand, the amount of money paid out on the remaining goods was higher in France. Above £350,000 was spent by the French on computers which were slightly more than the British who spent exactly £350,000. Neither of the countries spent much on perfume which accounted for £200,000 of expenditure in France but under £150,000 in the UK.
I have mentioned the detail of every strategy to solve the IELTS exam to get 9 bands in the Ultimate Guide to Hacking IELTS. You’ll learn the exact strategies, frameworks, tactics, and examples of how to solve every section to score 8+ in each of the 4 components of IELTS.
You can access the course here: